Choosing indicators

team

Selecting indicators is about balancing priorities with available data.

There are many free and publicly available indicator sets. Here are some points to consider before you start choosing specific metrics:

Scale: Indicators about health and the built environment are available at many scales, from individual buildings, neighbourhoods, cities and beyond. This is important if you want to be able to compare your project or area to another. You can choose metrics to measure in a building or neighbourhood based on what is available at comparable scales or for the whole city.

Purpose: The metrics that you choose will have limitations, so be clear about what purpose the information will serve. If you want to show that one area is disadvantaged compared to others, you will need comparisons with other places (see above). Perhaps you want to see how something changes over time. In this case, the data will need to be gathered periodically. Setting a clear purpose helps to narrow down which indicators can be used.

Cost: Collecting data can be expensive, but there are many freely available datasets that report useful indicators. If these sources are likely to keep reporting over time (this is a big challenge), then you may be able to rely on such public data. Consider who will pay for data collection, which could include environmental monitoring or residents’ surveys.

Priorities: It may be true that we should ‘measure what matters’, but it is also true that ‘what gets measured matters’. There can be a tension between choosing the most important indicators for urban health and available data. This can result in many datasets reporting readily available data that may not be the most important issues for a particular community. It is worth considering which indicators are most important and reflective of local values and health priorities (see ‘Collaboration’ and ‘Don’t start from scratch’ below).

Collaboration: Selecting indicators is often a process that surfaces disagreements among built environment stakeholders. For example, gathering data may reveal problems that damage public or private sector organisations reputations. It can be useful to involve a wide range of stakeholders in choosing indicators to ensure that all parties have a chance raise concerns and solutions.

Don’t start from scratch

We conducted a review of global urban health indicator sets and found 145 internationally, so there is probably an indicator dataset available near you.(1) This means you don’t have to start from scratch. Check for the country-specific or international indicator sets using the link below.

If you want to develop your own indicator set for a specific project or place, you still don’t have to start from scratch. We’ve produced an indicator database with roughly 300 examples of published urban health indicators. You can search the database on this website (e.g. for air quality or waste) or download a copy to explore in detail.


References

(1) Pineo, H., Glonti, K., Rutter, H., Zimmermann, N., Wilkinson, P. and Davies, M. (2018b) Urban Health Indicator Tools of the Physical Environment: a Systematic Review. Journal of Urban Health. 95  (5), pp. 613–646. https://doi.org/10.1007/s11524-018-0228-8

Indicators Overview

Man looking at metrics

Urban health indicators focus on the health impact of cities, including the physical urban environment.

There are many metrics about our quality of life, wellbeing and health. These measures can be used to understand the current status, set targets and judge progress.

We can use indicators for any of the following (1):

  • understand a place and its impact on health to inform the development, monitoring and adjustment of urban policies
  • compare places or success of policy programmes (e.g. within a city, across cities or internationally)
  • support funding bids and/or decisions
  • involve the community in agreeing priorities.

The value of indicators for communication

Here are a few examples where a headline figure helps to communicate a key challenge or opportunity.

Highlighting a problem

The first two examples show how indicators can highlight problems with the current state or proposed changes in the built environment.

<13% of new homes were located within walking distance of a railway, light rail or metro station

Royal Town Planning Institute (2016)

An analysis of planning permissions for new residential development in 12 city regions in England included data for 165,000 planned new homes.(2) Less than 13% were located within walking distance of a railway, light rail or metro station. Only 46% were located in an existing built-up area. This is likely to mean that many new homes are spatially disconnected from shops, schools, local services and convenient public transport. Residents of these new developments will probably rely on cars for the majority of their daily trips.

43% of British people are living in homes which do not meet the Living Home Standard.

Shelter

Shelter’s Living Home Standard highlighted the condition of housing in the UK. The standard looks at affordability, space, stability, decent conditions and neighbourhood – all of which are important for health. The charity has a dashboard that reports the percentage of homes that fail to meet the standard across different tenures and occupants’ characteristics (e.g. age, income, etc.).(3)

Measures of impact

The next few example shows how indicators can measure impact. The first is about the financial value of walkable neighbourhoods.

$4k – $34k Increased value of homes in highly walkable communities in USA

Cortright (2009)

A study of American cities found that houses with high walkability scores sold at values of $4,000 to $34,000 higher than homes with average walkability scores.(4) The walkability scores were measured by a tool called ‘Walk Score’ which is based on a combination of population density, access to services and street layout. 

Finally, this last example looks at the physical activity levels of residents in a new development, which is important for health.

40-50 min/week more physical activity since moving to the new development

Kramer et al. (2014)

A master-planned community called Mueller in Austin, Texas included 5,700 homes. The new community was studied by researchers who found that residents in early phases increased their physical activity levels by 40-50 minutes per week.(5)


References

(1) Pineo, H., Zimmermann, N., Cosgrave, E., Aldridge, R.W., Acuto, M. and Rutter, H. (2018a) Promoting a healthy cities agenda through indicators: development of a global urban environment and health index. Cities & Health. 2  (1), pp. 27–45. https://doi.org/10.1080/23748834.2018.1429180

(2) Royal Town Planning Institute, 2016. The location of development: Mapping planning permissions for housing in twelve English city-regions.

(3) http://www.shelter.org.uk/livinghomestandard

(4) Cortright, J., 2009. Walking the walk: How walkability raises home values in US cities. CEOs for Cities

(5) Kramer, A., Lassar, T.J., Federman, M., Hammerschmidt, S., 2014. Building for Wellness: The Business Case. Urban Land Institute, Washington DC.

Zero carbon

Greenhouse gas emissions, including carbon dioxide, are the cause of climate change which has numerous health impacts globally. Carbon emissions can be reduced through urban built environments through land use, transport, and buildings, among other factors.

Below is a short evidence review about a selection of evidence-based design and planning measures that can reduce carbon emissions and support health. These are accompanied by a set of example indicators that may inform strategies or be used for monitoring.

Evidence-based design measures

This section summarises work by Margalit Younger and colleagues who reviewed key built environment design measures to reduce emissions, promote health and prepare for climate adaptation. (1)

Reducing motor vehicle travel supports climate change mitigation and may reduce injuries and support active travel. Reducing traffic pollution leads to reduced respiratory illnesses and noncommunicable diseases. It also supports increased social capital which improves mental health and wellbeing. Evidence-based measures to reduce the need to travel via motor vehicles include:

  • provision of public transport
  • mixed-use development
  • active mobility infrastructure
  • encouraging food vendors to use local suppliers
Solar panels on homes in Almere, Netherlands. Image by Daria Nepriakhina from Pixabay.

Decreasing carbon emissions in buildings can be achieved by:

  • Installing decentralised low or zero carbon energy systems
  • Using low carbon and/or recycled construction materials
  • Increasing energy efficiency in buildings can improve thermal comfort (where cooling is also considered)
  • Reducing reliance on mechanical heating and cooling through building orientation and location
  • Situating stairs in prominent locations
  • Using low energy or passive lighting and sensors
  • Use a sustainable building/neighbourhood standard

Indicators

Here are a selection of indicators used to drive carbon reductions, and in doing so to support health, through strategy development and monitoring:

  • Consumption of electricity per household in megawatts/hour (2)
  • Electricity generated from renewable sources (% of total electricity generated) (3)
  • Number (or %) of new (or refurbished) building stock certified with a sustainable building standard (e.g. BREEAM and LEED) (4)
  • See physical activity and mobility infrastructure indicators.

References

(1) Younger M, Morrow-Almeida HR, Vindigni SM, Dannenberg AL. The Built Environment, Climate Change, and Health. Am J Prev Med 2008; 35: 517–26. https://doi.org/10.1016/j.amepre.2008.08.017

(2) McCaughey Centre, VicHealth Centre for the Promotion of Mental Health and Community Wellbeing, University of Melbourne. Community Indicators Victoria: Data Framework. http://www.communityindicators.net.au/metadata_items (accessed Feb 17, 2016).

(3) Giap TK, Thye WW, Aw G. A new approach to measuring the liveability of cities: the Global Liveable Cities Index. World Rev Sci Technol Sustain Dev 2014; 11: 176–196. DOI: 10.1504/WRSTSD.2014.065677

(4) Pineo, H., Zimmermann, N., Cosgrave, E., Aldridge, R.W., Acuto, M., Rutter, H., 2018. Promoting a healthy cities agenda through indicators: development of a global urban environment and health index. Cities & Health 2, 27–45. https://doi.org/10.1080/23748834.2018.1429180

Digital engagement

Websites and apps are a relatively new way to engage with the public for policy development and specific development proposals. Public engagement apps, like Commonplace and City Swipe, can be used on smartphones, tablets and computers and provide a way to reach a different demographic (usually younger) than is typical found at engagement events.

The London Borough of Waltham Forest used the Commonplace app to engage the local community on a £30m investment program in local cycling facilities and public space. Over 15,000 comments were received from the public about their needs and feedback on design.

The findings in Waltham Forest were unexpected for some members of the community. For example, local shop owners thought that most people drove to their shops and were surprised to find that most people walk.(1) Questions can be loaded on to the app in a survey format. Data is analysed immediately and accessible in reports and infographics via a client dashboard.

Glasgow City Council worked with the Glasgow Centre for Population Health and the Greater Glasgow and Clyde NHS to create a placemaking tool called HSN Placemaker. The two key areas of focus for the project were to use placemaking to reduce obesity (through walking and cycling) and mental illness (through greater involvement in neighbourhood design and decision-making).

The interactive Placemaker tool sought to stimulate thinking and debate. Users accessed images of existing streetscapes across Scotland and chose from a selection of options to change the look or use of a place. During the process of using the tool, users were prompted to think about the impact of their choices on community health and wellbeing and the natural environment.

This tool was used to inform the Place Standard tool which has a strong emphasis on health and wellbeing.(2)

Further information

(1) Commonplace Case Study: Waltham Forest Mini Holland. Available from: http://commonplace.is/resources/miniholland-casestudy.pdf (accessed Sept 8, 2016).

The information above is summarised from a report on Healthy Planning and Regeneration: innovations in community engagement, policy and monitoring.

Group street audit

Organising a walkabout or community street audit can expose local issues and opportunities. These activities can be done with specific groups, such as children or older people, that may otherwise be hard to reach.

The Community Street Audit method was designed by Living Streets and is comparable to other survey methods where planners or researchers walk through a neighbourhood with residents to discuss and record perceptions.

Living Streets define their audit tool as ‘a way to evaluate the quality of streets and spaces from the viewpoint of the people who use them, rather than those who manage them.’(1)

In Glasgow, Scotland a Community Street Audit was undertaken in Calton by Living Streets. This audit was part of a larger healthy urban planning project and focused specifically on walking.

Residents were concerned about safety issues, a poor built environment and the poor quality of the neighbourhood generally. Although walking was the main form of transport for residents, the area had the lowest levels of physical activity in Glasgow’s Smarter Choices Smarter Places Programme.

The Calton area was not far from Glasgow city centre, yet residents did not want to go into the centre to access most activities and services. More detailed findings uncovered issues with pedestrian facilities such as crossings, pedestrian priority (length of crossing time), legibility, local traffic speeds, accessibility, maintenance, crime and safety.

The report also explored assets that could be further developed or improved (such as a disused church that could be a café or community centre) for use as local social destinations.

The findings from the audit were intended to inform the council’s local development framework. A senior planner from the council was quoted as saying:

‘The response to the Street Audit has been positive and we have obtained funding to deliver ‘quick wins’ in the area. The final report is proving a very useful document for attracting funding and justifying spend in the area.’(2)

Further information

(1) Living Streets. Calton: Unlocking the potential – A report of a Community Street Audit for Glasgow City Council. 2011.

(2) Glasgow Equally Well Test Site: Integrating Health and Urban Spatial Planning. 2012.

The information above is summarised from a report on Healthy Planning and Regeneration: innovations in community engagement, policy and monitoring.

Participatory mapping

Although communicating through maps is sometimes seen as a ‘top down’ approach by local government, there are various participatory mapping approaches that seek to rebalance the data used in policy and decision-making.

Some benefits of mapping are that it can help participants to express complex relationships and perceptions of neighbourhoods. This can also contribute to social capital and stimulate interest in and engagement with land-use planning.(1,2)

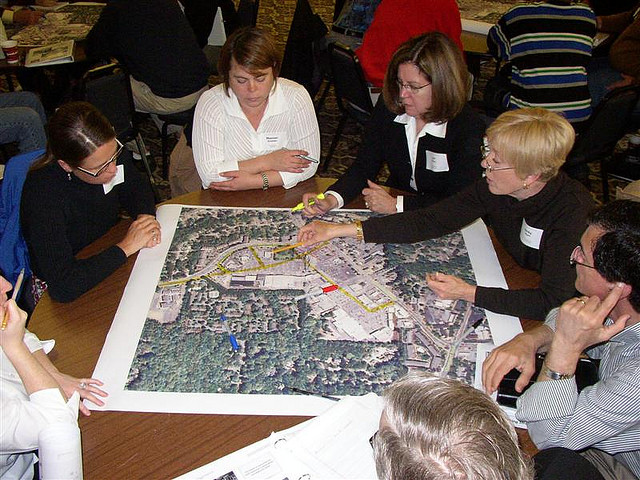
Mapping can be done in a variety of ways using one-to-one or small group sessions. Participants can work directly with maps or data can be gathered (e.g. through walks, focus groups or photos) and later applied to maps for analysis.

A project in Western Canada involved ‘experiential group walks’ with older people in an affordable senior housing development.(3) Researchers worked with a diverse group of older people (60+) and local decision-makers and service providers. The project used the group walks and a separate mapping workshop to gather residents’ views about place, including active participation in the community and social networks.

Additional workshops developed the results into solutions and an implementation plan. The results showed that older people wanted more accessibility and availability of age-appropriate community activities to support socialising with peers.

Another example related to mapping healthy food access. This project was in a part of Sandwell, England with high levels of obesity, diabetes and other chronic disease. The project used food mapping and interviews. The findings demonstrated that there were ‘large networks of streets and estates within Sandwell with no shops selling fruit and/or vegetables, or if such food did exist it was unaffordable.’(4)

Small retail shops were struggling to survive in the area, particularly if they attempted to sell perishable foods. This mapping led to winning a Neighbourhood Renewal Fund grant for an ‘Eatwell in Sandwell’ project, which linked regeneration and health through food in three neighbourhoods. The team created Food Interest Groups (FIGs) to address the issue of demand, or lack of demand, for healthy foods, using knowledge from the community.

Further information

(1) Talen E. Bottom-Up GIS: A New Tool for Individual and Group Expression in Participatory Planning. Journal of the American Planning Association 2000; 66: 279–94.

(2) Corbett J. Good practices in participatory mapping: A review prepared for the International Fund for Agricultural Development (IFAD). 2009. https://www.ifad.org/documents/10180/d1383979-4976-4c8e-ba5d-53419e37cbcc (accessed Sept 8, 2016).

(3) Fang ML, Woolrych R, Sixsmith J, Canham S, Battersby L, Sixsmith A. Place-making with older persons: Establishing sense-of-place through participatory community mapping workshops. Social Science & Medicine DOI:10.1016/j.socscimed.2016.07.007.

(4) Rosemary Kyle, Angela Blair. Planning for health: generation, regeneration and food in Sandwell. Intl J of Retail & Distrib Mgt 2007; 35: 457–73.

The information above is summarised from a report on Healthy Planning and Regeneration: innovations in community engagement, policy and monitoring.

Using images

Photographs are a great way to understand perceptions of place. Image-based methods can be particularly useful for engaging with young people or those with varying verbal/writing abilities. Specific approaches include ‘photo-survey’ and Participatory Photo Mapping.

Photo survey combines participants’ photos (taken independently) with discussion of the photos in one-to-one interviews.(1) This method gives power and control to the participant and may uncover parts of the city and residents’ lives that are not often seen by ‘outsiders’.

Participatory Photo Mapping (PPM) is similar to a photo-survey with two additional steps of mapping the images and developing actions to present to policy and decision-makers.(2) Many combinations of these approaches are possible and need not follow any prescribed formula.

In Belfast, the local authority organised a series of workshops with school children to understand their views about the health impact of their local environment.(3,4) The children were given single use cameras and allowed to photograph their school environment and its surroundings.

The aim was to give children a voice and a role in the policy and decision-making process. The children expressed strong preferences for green spaces (even small lots), clean public spaces and calmer traffic.

Further information

(1) Moore G, Croxford B, Adams M, Refaee M, Cox T, Sharples S. The photo‐survey research method: capturing life in the city. Visual Studies 2008; 23: 50–62.

(2) Dennis Jr. SF, Gaulocher S, Carpiano RM, Brown D. Participatory photo mapping (PPM): Exploring an integrated method for health and place research with young people. Health & Place 2009; 15: 466–73.

(3) Shaping Healthier Neighbourhoods for Children. 2011. http://www.belfasthealthycities.com/sites/default/files/HealthierNeighbourhoodsReport.pdf (accessed May 10, 2017).

(4) Boydell L. Shaping healthier neighbourhoods for children. 2012. http://www.healthycities.org.uk/uploads/files/045_belfast.pdf.

The information above is summarised from the report ‘Healthy Planning and Regeneration: innovations in community engagement, policy and monitoring‘.

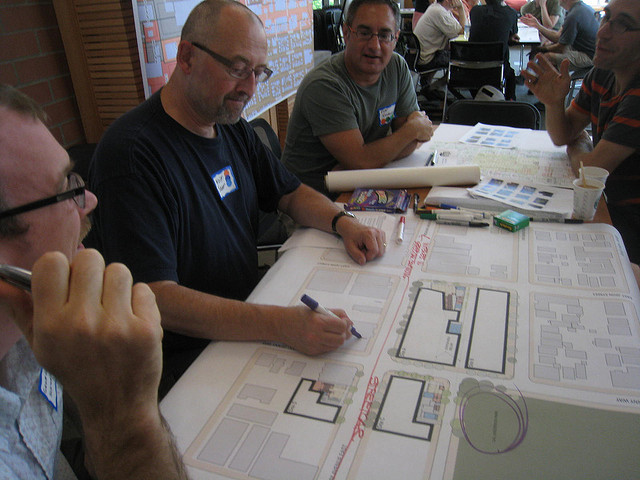
Community workshop or event

Community workshops and events can accommodate many people and provide an opportunity for local government or a developer to both communicate messages and hear from the community. Community groups may also be able to help with organisation and facilitation of large events.

One example of community participation related to mobility infrastructure is from Newcastle City Council in England. The Council began developing a city-wide Movement and Access Plan in 2010. They recognised the importance of mobility for health equity and wellbeing alongside sustainability and economic development issues.

A team of transport planners, representatives of vulnerable people and healthy policy staff spent five months preparing for an engagement event with local residents to gather views about mobility issues in the city. The group gathered existing data and asked a range of community groups to prepare posters about travel in the local area.

There were 90 people at the event which began with a drama performance to highlight the difficulties older people face when leaving the house. The ice-breaker was followed by small group discussions in nine ‘Travel Zones’ using the prepared posters.

In the small groups, participants used stickers to connect their ideas to improvements across the wellbeing topic areas: social wellbeing/inclusion, physical wellbeing, emotional wellbeing, financial wellbeing or environmental wellbeing.

Voting pads were used to gather data during the event. Respondents reported having the greatest difficulty getting to leisure and learning opportunities, followed by family and friends, work and shopping. People described a number of barriers to getting around on foot and they developed solutions to address these issues.

Barriers included:

• parked cars on pavement
• pot holes
• loose pavements
• road safety
• facilities
• slippery pavement surfaces
• width of roads and pavements
• wheelie bins obstructing pavements
• poorly lit subways
• off putting shrubbery
• litter

Solutions to these issues included:

  • railings on pavements to prevent car parking
  • better maintenance of paving
  • improved lighting
  • restricting height of plants
  • inspection of city pedestrian crossings with the Disability Forum
  • better winter maintenance
  • resolving issues with drainage channels and accessible buses
  • addressing hazardous metal studs in the city centre

Organisers said that the event helped to build a sense of common understanding of the mobility issues facing people in the city. It also helped the transport and planning officers connect with different stakeholders and residents. The event supported a bid to a Local Sustainable Transport Fund.

Further information

Getting out and about easily. 2011. Newcastle Partnership. Available from: https://www.wellbeingforlife.org.uk/sites/default/files/Getting%20out%20and%20about%20easily%2018th%20Feb%202011.pdf (accessed Sept 24, 2016).

Getting out and about easily by Foot: Tablecloth Comments. 2011. Available from: https://www.wellbeingforlife.org.uk/sites/default/files/GOAB%20Easily%20by%20Foot.pdf (accessed Sept 24, 2016).

The information in this post is summarised from the report ‘Healthy Planning and Regeneration: innovations in community engagement, policy and monitoring‘.

Image credit: Peds.org, design workshop

Asset Mapping

A commonly recommended approach to understanding places which are important for social networks and interaction is community asset mapping. Existing community assets can be used to build social capital through a variety of programmes such as befriending schemes and supporting volunteering.

An example of asset mapping for health is from Seattle, Washington, USA. Planners used asset mapping to undertake a Healthy Living Assessment as part of the planning process for a small area plan in the Rainier Beach neighbourhood.(1)

The assessment combined public health data with data collected at the local level by asking residents to map neighbourhood assets and how they commuted to these. The planners then produced maps which showed the community gathering places and how they were connected.

The Healthy Living Assessment included a framework, indicators, a questionnaire and asset mapping.

(1) Ricklin A, Kushner N. Healthy Plan Making – Integrating Health Into the Comprehensive Planning Process: An analysis of seven case studies and recommendations for change. Available from: https://planning-org-uploaded-media.s3.amazonaws.com/legacy_resources/research/publichealth/pdf/healthyplanningreport.pdf.

Image credit: JSeattle

Strengthening planning & health in England

In England, the planning and public health systems are nationally structured to create the policy opportunities for healthy place-making in local government. Yet, there is a frequent failure to create healthy communities that supported by infrastructure and housing that supports equity, sustainability and inclusion. There are many reasons for this, including a narrow focus on housing delivery above issues of quality.

With collaborators working across English local and national government organisations, we wrote an analysis in the British Medical Journal outlining the opportunities to increase healthy urban planning in England.

Key recommendations from the analysis include:

  • ‘Built environments are designed and developed using guidance from quality assured sources such as Public Health England and the Town and Country Planning Association
  • Person centred design is favoured over an infrastructure led plan to ensure places support healthy, active communities
  • The approach to person centred design is strengthened by ensuring that local health needs are linked to the planning policy process, led by integrated care systems
  • A stronger focus is placed on prevention and promoting the conditions for good health within all built environment plans, designs, and developments.’

This collaboration and the resulting paper was developed following a Salzburg Global Seminar in partnership with Robert Wood Johnson Foundation. A number of other papers and blogs were written by global practitioners and academics working in healthy and equitable urban planning.


References

McKinnon, G., Pineo, H., Chang, M., Taylor-Green, L., Strategy, A.J., Toms, R., 2020. Strengthening the links between planning and health in England. BMJ 369. https://doi.org/10.1136/bmj.m795