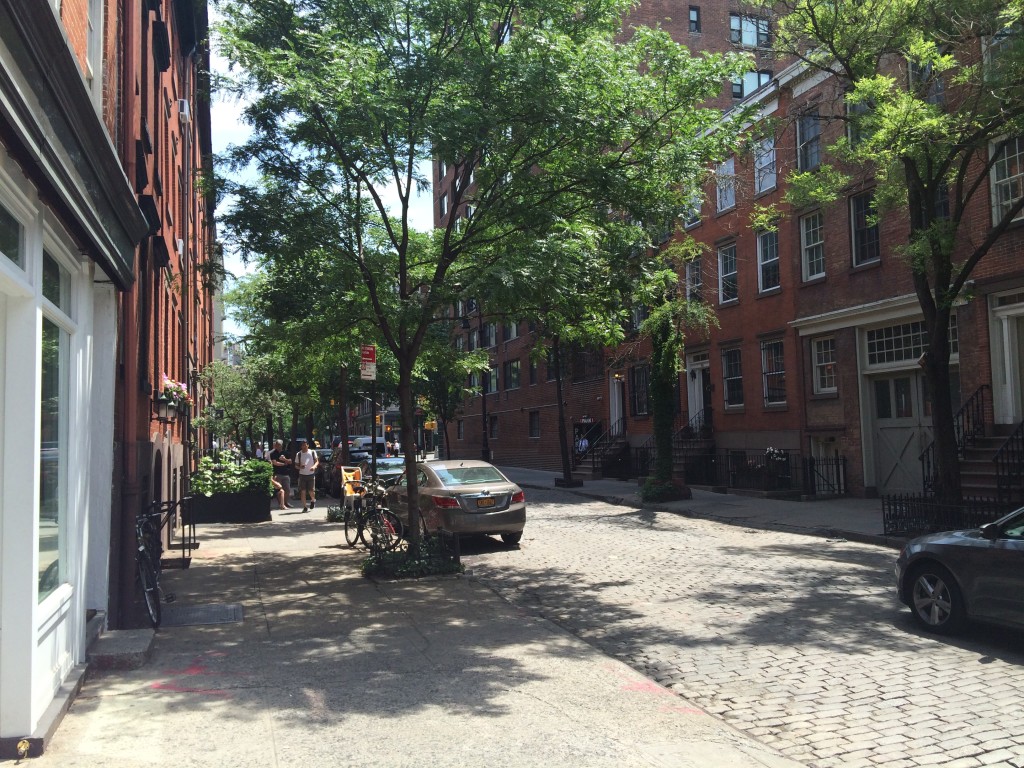
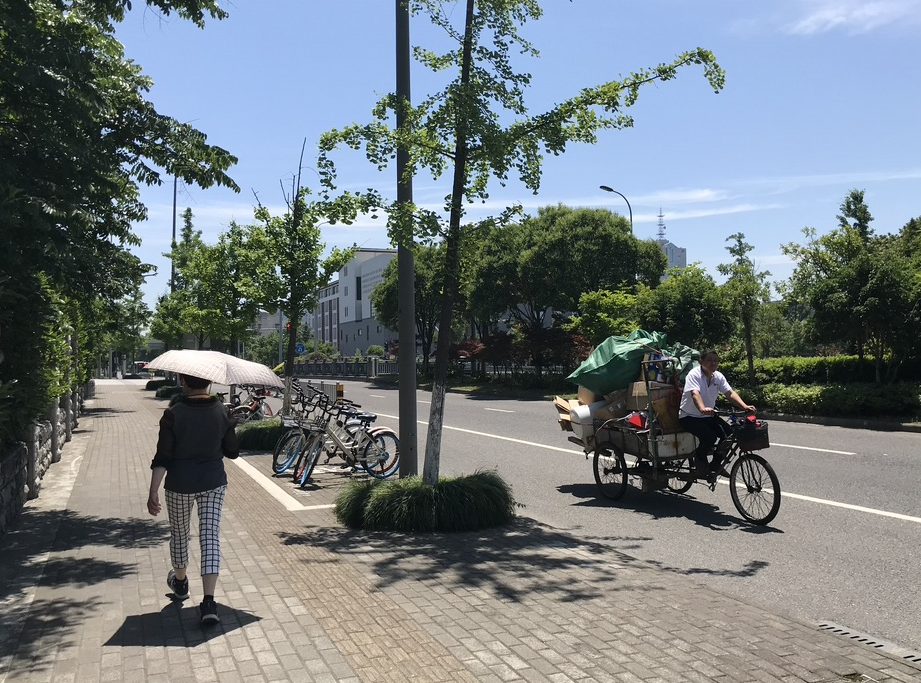
Transport and mobility infrastructure in cities has many impacts on health and wellbeing, that can be positive or negative. Increasing public transport access to jobs and schools is good for health, while reliance on cars causes pollution and reduced pedestrian safety.
Beyond these local health impacts, transport infrastructure can contribute to climate change and create barriers for wildlife.
Supporting physical activity
There are many health benefits of active transport and mobility infrastructure, including maintaining a healthy weight, reducing risk of chronic disease and improving mental health and wellbeing. Societal also benefits from increasing physical activity through job growth, increased productivity, reduced crime and better social cohesion, to name a few. (1)
The built environment supports physical activity in many ways, through:
- net residential density, intersection density, and public transport density (2);
- proximity (neighbourhood density and mix of uses) and connectivity (ease of movement between destinations) (3);
- sidewalks, street-lighting, and safe crossings (e.g. pedestrian signals and mid-street islands) (3);
- building design
- provision of recreational facilities
- other factors.

Evidence-based design measures
Research shows that the following design and planning measures related to mobility infrastructure can support health:
- Safe active travel routes for all, and especially to schools (4), including dropped curbs at crossings, no obstacles on pavements, safe spaces for pedestrians near vehicle service or drop-off points, etc. (see perceived safety)
- Walking and cycling routes are well-connected and provide direct routes between destinations (5), including design for legibility and wayfinding such as urban form and signage
- Places to rest in public spaces (suitable to different seasons, providing shade and shelter) and access to toilets. (6)
In addition, these built environment measures support physical activity:
- Free or low-cost publicly available facilities/areas that allow opportunities for physical activity (7)
- Indoor and outdoor public recreation facilities (8)
- Active building design through: prominent location and design of stairs, sit-stand and treadmill desks, location of communal areas and toilets in central areas, walking/running tracks and on-site exercise facilities. (6)

Indicators
There are many of urban health indicator tools focused on walkability or wider active transport features. For example, the ‘Physical Activity Neighborhood Environment Scale (PANES)’ tool is a survey that can be used to assess whether existing built environment features support activity. It measures land use mix, residential density, pedestrian infrastructure, aesthetic qualities, and safety from traffic and crime – among other features. (9)
Here are some examples of indicators related to mobility infrastructure, more can be found in the references:
- Walk trip occurrence to work or school (10)
- Sidewalk Quality: % of sidewalks with shade tree coverage (11)
- Transit Service Quality: % of accessible buses for mobility impaired (11)
- Sidewalk Accessibility: % of crossings with curb cuts (11)
- Ratio of bicycle path and lane miles to road miles (12)
For broader indicators for supporting physical activity through the built environment, here are a few examples:
- Reasonable distribution of (environmentally-friendly) public toilets (13)
- % of residents that have access to public exercise facilities in their neighbourhood (14)
- Parks and recreation facilities in the neighbourhood (public or private) are accessible for all residents (7)
- % of people using outdoor space for exercise/health reasons (15)
- Number and quality of children’s play areas accessible to residents (16)
- % respondents satisfied with children’s playgrounds and play areas (17)
Guidance
The Health Economic Assessment Tool (HEAT) for Walking and Cycling was developed by the World Health Organization to measure the economic value of health benefits achieved from reduced mortality from walking and cycling. (18)
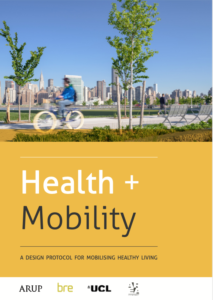
A research collaboration between Arup, BRE, University College London and AREA Research (Perkins+Will) aimed to help decision-makers deliver better mobility infrastructure in their cities through an improved understanding of the impact of mobility/infrastructure on wellbeing.
The resulting design protocol explained the links between physical and mental health to the availability of active and non-active transport modes for daily journeys.

References
(1) Designed to Move, Active Cities: A Guide for City Leaders. 2015; published online June. http://www.designedtomove.org/resources/active-cities.
(2) Sallis JF, Cerin E, Conway TL, et al. Physical activity in relation to urban environments in 14 cities worldwide: a cross-sectional study. The Lancet 2016; 387: 2207–17.
(3) Saelens BE, Sallis JF, Frank LD. Environmental correlates of walking and cycling: Findings from the transportation, urban design, and planning literatures. Ann Behav Med 2016; 25: 80–91.
(4) Younger M, Morrow-Almeida HR, Vindigni SM, Dannenberg AL. The Built Environment, Climate Change, and Health. Am J Prev Med 2008; 35: 517–26.
(5) Panter J, Guell C, Humphreys D, Ogilvie D. Title: Can changing the physical environment promote walking and cycling? A systematic review of what works and how. Health Place 2019; 58: 102161.
(6) Pineo H, Rydin Y. Cities, health and well-being. London: Royal Institution of Chartered Surveyors, 2018 http://www.rics.org/uk/knowledge/research/insights/cities-health-and-well-being/ (accessed June 19, 2018).
(7) Kim S, Adamson KC, Balfanz DR, et al. Development of the Community Healthy Living Index: A tool to foster healthy environments for the prevention of obesity and chronic disease. Prev Med 2010; 50, Supplement: S80–5.
(8) Bethlehem JR, Mackenbach JD, Ben-Rebah M, et al. The SPOTLIGHT virtual audit tool: a valid and reliable tool to assess obesogenic characteristics of the built environment. Int J Health Geogr 2014; 13. DOI:http://dx.doi.org.libproxy.ucl.ac.uk/10.1186/1476-072X-13-52.
(9) Sallis, J.F., Kerr, J., Carlson, J.A., Norman, G.J., Saelens, B.E., Durant, N., Ainsworth, B.E., 2010. Evaluating a brief self-report measure of neighborhood environments for physical activity research and surveillance: Physical Activity Neighborhood Environment Scale (PANES). Journal of physical activity and health 7, 533–540.
(10) Ulmer JM, Chapman JE, Kershaw SE, Campbell M, Frank LD. Application of an evidence-based tool to evaluate health impacts of changes to the built environment. Can J Public Health 2015; 106: ES26–32.
(11) Peterborough County-City Health Unit; GreenUP; City of Peterborough. Active transport and health: indicators report. 2014. Available from: http://www.peterborough.ca/Assets/City+Assets/TDM/Documents/indicators+report.pdf. Accessed 20 Nov 2015.
(12) About the SF Indicator Project. The San Francisco Indicators Project. http://www.sfindicatorproject.org/about. Accessed 29 Mar 2016.
(13) Gu C, Dongping Y. The Environmental Risks Of Rapid Urbanization: Indicators For Livable Cities. In: Chinese Research Perspectives On The Environment, Vol 1: Urban Challenges, Public Participation, And Natural Disasters. PA LEIDEN: BRILL, 2013: 159–73.
(14) Colorado Health and Environmental Data, Colorado Department of Public Health. Colorado Health Indicators. http://www.chd.dphe.state.co.us/HealthIndicators/home/index (accessed Feb 11, 2016).
(15) Public Health England. Public Health Profiles, Wider Determinants of Health, Built and Natural Environment. https://fingertips.phe.org.uk/profile/wider-determinants/supporting-information/built-and-natural-environment (accessed Aug 4, 2019).
(16) Weich S, Burton E, Blanchard M, Prince M, Sproston K, Erens B. Measuring the built environment: validity of a site survey instrument for use in urban settings. Health Place 2001; 7: 283–92.
(17) Bristol City Council. The quality of life in Bristol. bristol.gov.uk. https://www.bristol.gov.uk/statistics-census-information/the-quality-of-life-in-bristol (accessed Oct 30, 2016).
(18) Kahlmeier S, World Health Organization, Regional Office for Europe. Health economic assessment tools (HEAT) for walking and for cycling: methodology and user guide : economic assessment of transport infrastructure and policies. 2011.


One Reply to “Mobility infrastructure”
Comments are closed.