The Global Centre for Healthcare and Urbanisation at Kellogg College, University of Oxford held a public seminar on healthy cities. I spoke about reframing our understanding of healthy urban environments, focusing on the need to improve the design quality of new development in England.
Folkets Park
Nørrebro, one of the most densely populated, diverse, and disadvantaged neighbourhoods in Copenhagen, is home to Folkets Park (literally, “People’s Park”). It is a small urban park with a rich history as a place associated with local grassroots activism.
Residents created the park in 1971 on the site of a burned down building as a place for children to play. The adjacent Folkets Hus community centre was the site of local activism between the 1960s and 1980s, largely focused on disagreement over urban renewal. In the decades following there was not much municipal intervention in the park, but this shifted after a violent crime in 2012 that spurred the need for a re-design process focused on safety and inclusion.
The 2013 renovation of Folkets Park aimed to create a public space where all users could feel safe and comfortable. Perceived safety and the provision of public greenspace were the main determinants of health for this project. Another key aspect of this project was the aspiration to embed an inclusive and collaborative approach throughout the design process. As explained in guidance by the Gehl Institute, this exemplary project demonstrates how “when designing healthy places, inclusion can be a goal, a process, and a result”.(1)
This project is featured as one of our healthy urban development case studies and this case study was written by Elizabeth Cooper.
Continue reading “Folkets Park”UniverCity Childcare Centre
The UniverCity Childcare Centre at Simon Fraser University (SFU) was the first childcare centre in the world to obtain the Living Building Challenge (LBC) standard. It was an early adopter of the LBC standard, which originated in British Columbia. The Centre is linked to the SFU Faculty of Education for research on the provision of innovative childcare. After the building was completed and in operation, university researchers engaged with staff at the Childcare Centre in a community of practice model to study and inform the use of the building itself as part of the children’s ‘play-based holistic learning’ about sustainability.(1)
The design process was informed by sustainable building practices and the Childcare Centre’s adoption of the Reggio Emilia pedagogical three ‘teachers’ model whereby educators are considered to be the more than teaching staff, but also the environment in which the children learn and the community in which they live. Inclusive design processes helped the project team understand how children and staff wanted to use the space to support education and development.
This project is featured as one of our healthy urban development case studies.
Continue reading “UniverCity Childcare Centre”Queen Elizabeth Olympic Park
The Queen Elizabeth Olympic Park (QEOP) is large-scale, master planned urban regeneration project on the site of the 2012 London Olympic and Paralympic Games. The vision of the project was to use the opportunity of the London 2012 Games to create a dynamic new metropolitan centre for London and an inspiring place where people want to – and can afford to – live, work and visit.
Totalling 560 acres (226 hectares), the QEOP includes plans for up to 6,800 new homes and 91,000 square metres of new commercial space around substantial green and blue infrastructure. The open space includes ‘35km of pathways and cycleways, 6.5km of waterways, over 100 hectares (ha) of land capable of designation as Metropolitan Open Land, 45ha of Biodiversity Action Plan Habitat, 4000 trees, playgrounds and a Park suitable for year-round events and sporting activities’ (1). There are five residential neighbourhoods led by different private sector partners, in addition to East Village (the former Athletes’ Village), including Chobham Manor, East Wick, Sweetwater, Marshgate Wharf and Pudding Mill.
QEOP borders four East London boroughs, Hackney, Tower Hamlets, Newham and Waltham Forest, each with high levels of deprivation and comparatively poor health outcomes. Regeneration plans in each borough aimed to transform the site’s post-industrial landscape and create better living conditions for residents. The London Legacy Development Corporation (LLDC) is the official planning authority of the Olympic Park and was established in 2012 as a mayoral development corporation under the power of the Localism Act 2011. All the planning applications submitted within the boundaries of the Growth Area are processed by the LLDC instead of the local boroughs. This mechanism ensures an integrated approach to the ongoing development in a way which aims to be responsive and accountable to local concerns while reflecting the area’s strategic significance for London.
This project is featured as one of our healthy urban development case studies.
Continue reading “Queen Elizabeth Olympic Park”Via Verde
The Via Verde project was a response to several challenges for the South Bronx community of New York City: lack of high-quality affordable housing and high rates of asthma and obesity. Delivered through a public-private partnership with a complex financing model, Via Verde offers affordable high-quality homes for a broad range of income levels. Based on existing case study reports, its most successful features are the health-focused amenities and sustainable design, alongside the project’s value in changing perceptions about high-rise housing in America.
Green roofs and food gardens are planted on the rooftops of each building – the organising design feature behind the project’s name, Via Verde, meaning green way in Spanish. The project was the winning design in the New Housing New York Legacy Project (NHNY) competition. The multi-award-winning project is hailed as ‘a model for affordable, green, and healthy urban living’ by the Urban Land Institute.(1)
This project is featured as one of our healthy urban development case studies.
Continue reading “Via Verde”Healthy urban development case studies
What do exemplar healthy urban developments look like? With the growing interest in ‘healthy’ buildings and places, we wanted to understand what could be considered best practice. This research involved a large review of published case studies, using professional organisations, newspaper reports, published academic research and other sources.
Our summary of each case study will be published incrementally in Spring 2022.
Are the projects ‘best practice’?
In publishing these projects, we are not endorsing them as ‘best practice’ or making any claims about whether they are good for health and wellbeing. We are hoping to learn about what the wider industry and professionals perceive ‘healthy’ development to look like.
Each case study was selected because it met our selection criteria:
- Describes an urban development project that explicitly aimed to promote or safeguard human health and/or wellbeing (including the related term of liveability)
- Urban development cases are recent, built after 2000
- Substantive data are available
- Data are available from sources that are not solely marketing material
- Design measures or processes are described (related to health and wellbeing)
How were the projects analysed?
We extracted information about each project from multiple sources and entered this into a template. The template included general project details (project size, location, type of development, etc.) and information specifically related to health.
We used the THRIVES framework as a way to consider how health and wellbeing were supported in each project. In reporting each project we explain how it relates to THRIVES through three scales of health impact (planetary, ecosystem and local) and the core principles (inclusion, equity and sustainability).
Acknowledgements
This project was funded by Guy’s and St Thomas’ Foundation, an urban health charity in London. The research team includes Helen Pineo, Gemma Moore, Karla Barrantes Chaves, Elizabeth Cooper, Vafa Dianati, Kay Forster and Isobel Braithwaite.
How are indicators used in urban planning?
Policy-making is complex and contested, and health is only one goal among many to be achieved through implementing urban planning policy. We researched the complexity of this process using a systems thinking approach, mapping out the value of urban health indicators in two case studies.
Key findings
- Creating and using urban health indicator tools increased inter-sectoral relationships, which supported different stakeholders to better understand each other’s opportunities and constraints.
- Relationships among stakeholders spurred new advocates for health in diverse organisations, supporting health-in-all-policies and whole-of-society approaches.
- Constraints to health-promoting policy and implementation (e.g. legal, political and economic in nature), were overcome through community involvement in urban health indicator tools and advocacy effectiveness.
- Some characteristics of indicator tools reduced their perceived relevance and authority, such as: a high number of available indicators, lack of neighbourhood scale data and poor-quality data.
In this research of activities in Melbourne (Australia) and San Francisco (USA), urban health indicator tools were a form of evidence that influenced local urban planning policy and decision-making when they were embedded in policy processes, networks and institutions.
Systems thinking approach
This research used systems thinking to map out participants’ mental models of how indicators were used in planning policy and decision-making. The image below is one of the causal loop diagrams produced in the research. It shows how inter-sectoral relationships led to increased urban planning policy that would be health-promoting.

References
(1) Pineo, H., Zimmermann, N. and Davies, M. (2020) Integrating health into the complex urban planning policy and decision-making context: a systems thinking analysis. Palgrave Communications. 6 (1), pp. 1–14. https://doi.org/10.1057/s41599-020-0398-3
New Development
Indicators can be used to improve a new development’s impact on health and wellbeing.
Measuring whether we have achieved certain project goals is an important way for public and private sector organisations to demonstrate their success. In the property sector, professionals will already be familiar with key performance indicators (KPIs) that show outputs from buildings and infrastructure. KPIs may be about sales values, carbon footprint or cost per square metre, among other factors.
Using metrics to inform the healthy design, construction and maintenance of new development is new to most property and built environment professionals. Consultants may support this task, but everybody involved in the project can benefit from a basic understanding.
There are general factors to think about when choosing indicators, including: scale, purpose, cost, priorities and collaboration.
Pointers for using health indicators on new developments
Understanding the local context: As with other site investigations, you can use local public health data to understand key environmental exposures and health issues in the area. This may form part of a health impact assessment (HIA). For example, it may be possible to find local air pollution concentrations and rates of hospital admissions for asthma. Site surveys using indicators can be conducted with and without local residents to identify assets or hazards in the area. There are many healthy development checklists that can be used to support this process.
Set targets for the development: The developer and other stakeholders may set targets for how the development will seek to improve (or not harm) health through design and planning strategies. Existing standards are available (such as certification systems like WELL, Fitwel, LEED, and BREEAM) or a design team may develop their own set of targets. The database of 300 indicators may help with the selection of appropriate metrics. If indicators are used, there will be a need to specify current and target levels. Especially on large projects, early agreement on these targets will help all professions to ensure their contribution supports the health goals.
Monitor progress and results: If baseline measures have been taken, it will be possible to understand how the development has impacted the local environment in ways that support (or harm) health and wellbeing.
For short-term exposures such as noise and air pollution created during construction, it will be important to regularly monitor these and ideally to publicly report the results. If problems arise, mitigation measures can be taken to avoid harm.
For long-term benefits, such as increasing residents’ physical activity or wellbeing, developers could use public health indicators to determine impact. However, a few limitations should be noted:
- Whose health? The people living in the area before and after development are not always the same, so any uplift in health may not relate to local populations. Ideally, baseline measures of local residents who may benefit from the development can be taken to show a ‘before and after’ story.
- What caused any changes? Any differences in the environment or local health measured before and after a new development may not have resulted from the development itself. Changes could be caused by other factors, such as national or local air pollution control policies.
- How long to wait before measuring? Improvements to health could be immediate (e.g. if noise or air pollution is reduced) but in many cases they will take time to detect.
As a simple evaluation, developers (or other stakeholders) could pay for a survey of residents’ behaviours and self-reported health pre- and post-development.
Many of healthy urban environment guidance documents include useful monitoring indicators.
Indicator database
Organisations can save a lot of time and money by using existing indicators.
There are many benefits to using indicators that others have developed. If the indicator was developed by a public health agency, it is likely to have an evidence-based link to health. By using indicators that are reported elsewhere, you can compare data that you gather with other locations.
The database below is a selection of nearly 300 indicators across 22 categories. You can download the file or filter/search in the columns below. These are small selection of 8006 indicators that we identified in our review of urban health indicator tools.
The indicators below have been selected to show typical metrics under the available categories. We also provide examples that are relevant for inclusion, equity and sustainability. For further details on the source see this table.
Selection of urban health indicators
| General category | Indicator | Index/tool |
|---|
Successful examples
The San Francisco Indicators Project and Community Indicators Victoria are well-known tools that provide great lessons.
The indicator tools set up by public health teams in San Francisco (USA) and Victoria (Australia) have been widely used for built environment purposes. These projects provide useful lessons for organisations that are considering developing a new set of indicators.
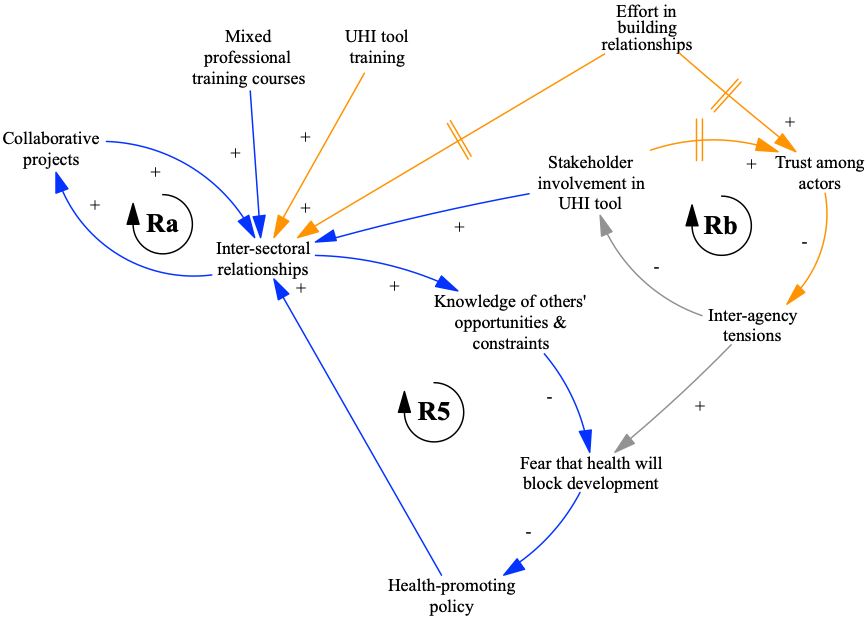
Key findings about indicator use in these case studies (1):
Inter-sectoral relationships were important: In the cases analysed, creating and using urban health indicator tools increased inter-sectoral relationships, which supported actors to better understand each other’s opportunities and constraints. These relationships spurred new advocates for health in diverse organisations, supporting health-in-all-policies and whole-of-society approaches.
Community involvement helped overcome constraints: When using urban health indicator tools to advocate for a healthier environment, there can be challenges. In these case studies constraints to health-promoting policy and implementation included those which were legal, political and economic in nature. Community involvement developing and using the indicators helped to overcome these constraints and supported advocacy.
Pitfalls of indicator projects: A number of factors reduced the perceived relevance and authority of indicator tools, including: a high number of available indicators, lack of neighbourhood scale data and poor-quality data.
These indicator tools were used as a form of evidence that influenced local urban planning policy and decision-making when they were embedded in policy processes, networks and institutions.
Do other indicators get used in practice?
Beyond the two examples above, does the time and effort put into developing indicators, pay off?
Looking across the published literature, here are the key findings about the use of indicators by built environment policy-makers (2).
Who creates the tools matters: Both expert-led and participatory indicator projects can be underpinned by research evidence and residents’ knowledge. Participatory UHI tools with community involvement were generally more effective at supporting “health in all policies” and “whole-of-society” approaches to governing healthy cities than expert-led processes.
Indicator use in policy-making is not linear: Studies highlighted a number of technical, organisational, political, knowledge, and contextual factors that affect their use.
Quality matters: Some indicator tool features, such as availability of neighbourhood-scale data, were influential in the use of indicators by built environment policy- and decision-makers.
References
(1) Pineo, H., Zimmermann, N., Davies, M., 2020. Integrating health into the complex urban planning policy and decision-making context: a systems thinking analysis. Palgrave Communications 6, 1–14. https://doi.org/10.1057/s41599-020-0398-3
(2) Pineo, H., Glonti, K., Rutter, H., Zimmermann, N., Wilkinson, P. and Davies, M. (2018b) Urban Health Indicator Tools of the Physical Environment: a Systematic Review. Journal of Urban Health. 95 (5), pp. 613–646. https://doi.org/10.1007/s11524-018-0228-8
Further information
Bhatia, R., 2014. Case Study: San Francisco’s Use Of Neighborhood Indicators To Encourage Healthy Urban Development. Health Affairs 33, 1914–22. http://dx.doi.org.libproxy.ucl.ac.uk/10.1377/hlthaff.2014.0661
Davern, M.T., Gunn, L., Giles-Corti, B., David, S., 2017. Best Practice Principles for Community Indicator Systems and a Case Study Analysis: How Community Indicators Victoria is Creating Impact and Bridging Policy, Practice and Research. Soc Indic Res 131, 567–586. https://doi.org/10.1007/s11205-016-1259-8
Farhang, L., Bhatia, R., Scully, C.C., Corburn, J., Gaydos, M., Malekafzali, S., 2008. Creating Tools for Healthy Development: Case Study of San Franciscoʼs Eastern Neighborhoods Community Health Impact Assessment. Journal of Public Health Management and Practice 14, 255–265. https://doi.org/10.1097/01.PHH.0000316484.72759.7b
